Top 5 affordable tools to make infographics in a snap
What makes infographics so popular? Jennifer Gregory, a content marketing writer and blogger, says that infographics have become more prominent because, “Each of us learns differently. A lot of people are visual learners. Seeing the visual illustration of a concept is useful for a large percentage of people.”
Plus, Infographics are 30 times more likely to be read than a normal text article, according to HubSpot.
To effectively produce an infographic, large companies turn to their creative team, but small businesses might not have the same resources. Thankfully, there are a number of sites that can help you create infographics quickly and on a budget. We’ve put together a list of the top five:
1. Piktochart
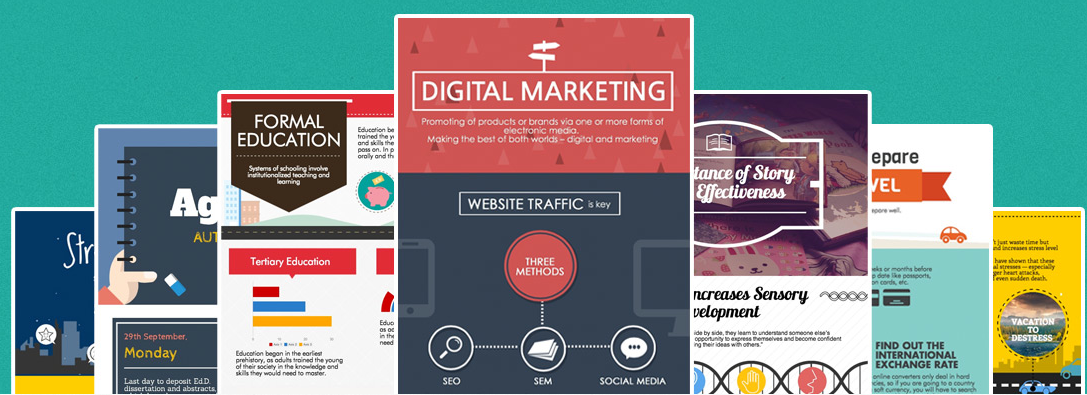
Piktochart comes complete with pre-programmed themes, more than 1,000 images to choose from and the ability to share your completed infographic. You can try is out with a free package, where you’ll be able to use the templates and 20 uploaded images, or pay up to $29 a month to receive the full benefits, which include icons, privacy controls and 200 uploaded images.
2. Canva
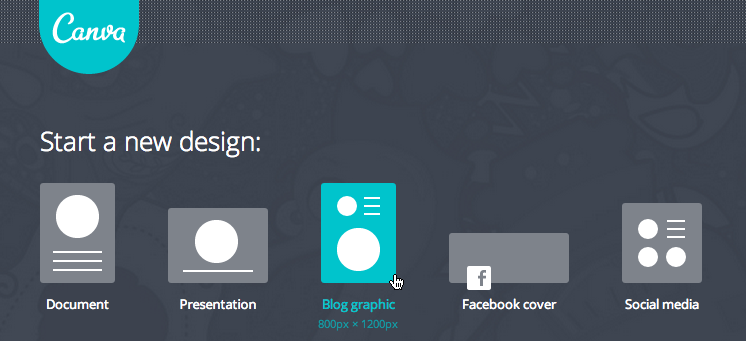
Canva offers a free, simple to use platform that contains hundreds of fonts and millions of images to incorporate into an infographic. Premium images are only $1 each, and the photos can be edited right within the program. You can share and edit your infographics with coworkers at any point in the creation process.
3. Venngage
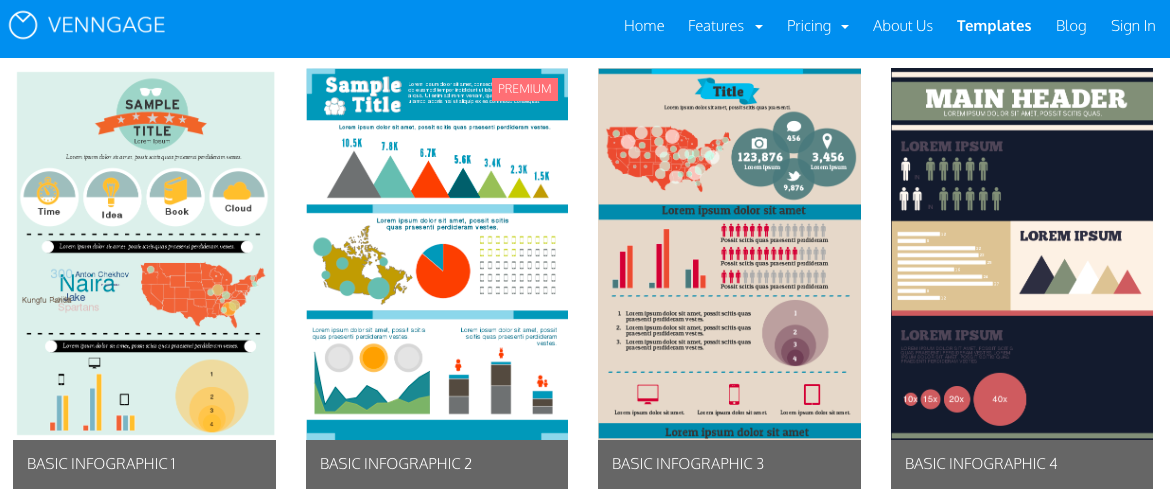
Like Canva and Piktochart, you get a limited number of free features on Venngage like themes, templates, charts and icons. The themes include reports, presentations and posters. Images from the web or your own computer can be uploaded into the infographic as well. Here’s a look at a few of the templates you can use in Venngage:
4. Visme
Visme, which is trusted by brands like Microsoft and Symantec, allows businesses to create infographics with a plethora of images and templates. When tapping into the free version, you can make up to three projects, are given 100 MB of storage space and can publish or download infographics as JPGs.
For $5 per month, you gain access to all charts and infograph widgets, premium support and 250 megs of storage.
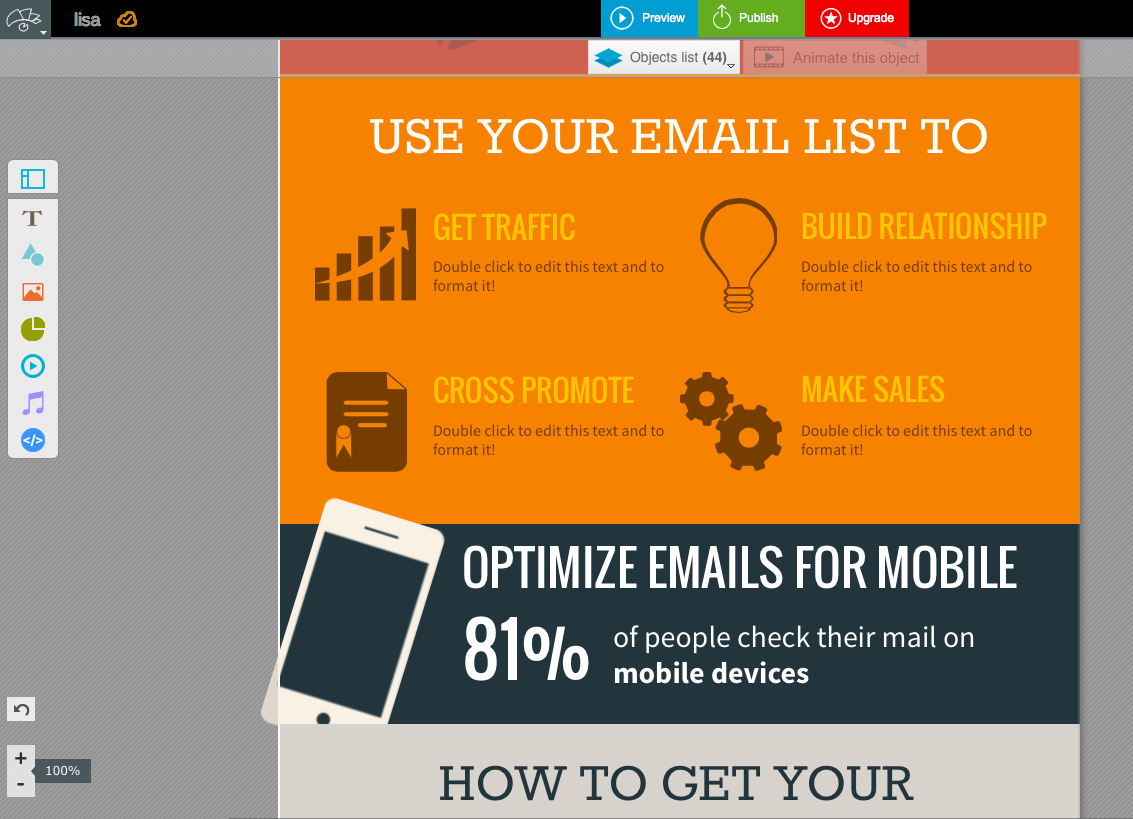
Here’s what the inside of the Visme editor looks like:
5. Sprites
Want to create an interactive infographic? Try turning your infographic into a video with Sprites. The infographics themselves are fully scalable and ready for any device including iPhones and iPads, and users can choose from a number of themes and images for free. If you pay $6 per month, you will receive Google Analytics integration, the ability to upload custom themes and password protection on any infographics created.
No matter which website you try, keep in mind that a good infographic serves the same purpose as a blog post, photo or newsletter. “When you create an infographic, it’s really important to approach it the same as you would an article,”says Gregory. “It has to tell a story in an interesting way, both visually and contextually.”
We recently put together some of our favorite marketing infographics of 2014. Check them out.
Have you used any of these tools to create infographics? If so, tell us about your experience in the comments below.
Kylie Jane Wakefield is a freelance writer and content creator in Los Angeles. She’s written for NewsCred, CMO.com, Forbes, Tablet Magazine, and The Jewish Journal of Los Angeles.
© 2015 – 2018, Contributing Author. All rights reserved.
