A Guide to Facebook Insights
Over a billion served, and we’re not talking burgers here. Facebook has evolved from being a place to chat with pals to a powerful business tool. Keep in touch with your customers or even sell your latest product, all from the familiar pages of Facebook. But lots of companies, especially smaller ones, struggle with how to define success when it comes to Facebook. Does this sound like you?
If so, listen up! One of the most important tools you need to start using is Facebook Insights, the platform’s free built-in analytics package. Insights has been around since 2009 and originally only collected basic demographic information of a page’s fans during the sign-up process. Over the years it has evolved into a more robust measurement tool that most pros find vital to their Facebook marketing success.
Here are some of the key things you can learn with Facebook Insights.
How Well are Your Posts Doing?
The “Overview” section shows you how each individual piece of content is resonating with your audience, as well as how you’re doing over time.
You can view how many people saw the post (“reach”); clicked on the post (“engaged readers”); liked, commented on or shared the post (people “talking about this”); and what percent of the people who saw the post also liked, commented on or shared it (“virality”).
This information can quickly and easily tell you what type of content is engaging your existing audience and flowing over to new potential “likers” of your Facebook Page.
You’re also able to review all your post types together or use the pull-down menu to dig deeper into specific types of content. In other words, you can view per-post analytics only for posts with photos, links, videos, questions or offers. This really comes in handy when you are trying to determine what type of content your community craves most.
Who Likes You?
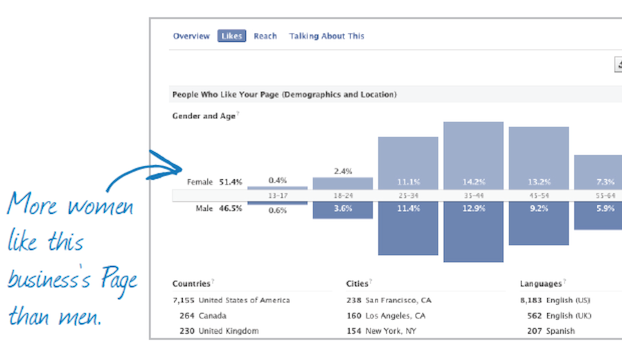
Insights allow you to get demographic and location information about the “likers” of your business’s Facebook Page. You can get valuable details like gender, age, country/city of origin and the language they speak.
You can also see a breakdown of what sources your new likes are coming from, as well as how many people unlike your Page. These stats can help you deliver targeted content to meet the needs of your audience.
Who Are You Reaching?
While the “Likes” section provides demographic data of all your “likers,” the “Reach” section offers demographic information on the folks who saw your content – which Facebook defines as people you’ve “reached” – during the last seven days.
Note that the percentages may not add up to 100 exactly, because some people do not disclose whether they’re male or female or where they’re from on their Facebook profiles.
This section also provides details on how you reached these people: organically on their news feed (“organic”); by way of a sponsored or advertised post that you paid to do (“paid”); or through the action of a friend (“viral”).
In the “Visits to Your Page” section you can see how many times your Page was viewed on each day for the last month. If you have tabs on your Page, it also shows your most-viewed tabs for the last month.
“External Referrers” is a great way to see where people are coming from, in terms of other websites, in the last month.
Who’s Talking About Your Page?
Insights also provide demographic information on the people who’ve liked, commented on or shared one of your posts – which Facebook calls people “Talking About This.” You can set it to show data from a specific time period.
In addition to knowing their gender, age, where they live and what language they speak, you can see how many unique people engaged with your content within your defined time period. The “Viral Reach” chart shows how many unique people saw your post(s) because a friend engaged with your content.
Export Data to Spreadsheet
To go even deeper with the analysis of your Page and content, Facebook provides a handy feature that allows an admin to export Page level data or post level data for a selected date range.
When it comes to your Page level data, some of the data points that you should pay close attention to include: People Talking About This, Page Engaged Users, Total Reach, Organic Reach, Viral Reach, Total Impressions, Organic Impressions, Viral Impressions, Negative Feedback from Users and Page Consumptions.
When you export your post level data, you’re able to get to a granular level that is just not possible when viewing the top-level content analytics. You can really hone in on the Total Reach, Organic Reach and Viral Reach as well as the Total Impressions, Organic Impressions and Viral Impressions of all your posts. You’re also able to see the lifetime count of likes, comments and shares of each post.
As with all things Facebook, Insights is getting an update, with easier to read analytics and a new People Engaged tab for more specifics on your Page visitors. The new update is currently in beta, but when it becomes more widely available we’ll get the scoop and fill you in on everything you need to know.
Once you’re ready to move beyond the number of Likes on your Facebook page, try exploring Insights. You may be surprised at what you find about your visitors and how it can help you make your Facebook Page be the best it can be.
© 2013 – 2018, VerticalResponse. All rights reserved.


