A Definitive Guide to Using Facebook Insights for Your Business
Obtaining and interpreting the Facebook Insights statistics on your fan page is one of the basic elements of any Social Media Marketing Plan. Thanks to them, we can analyze what happens on our page and if those actions we are implementing bring us closer to achieving the business objectives. Therefore, it is convenient to carry out this analysis regularly, at least once a month, either by the Community Manager or another assigned person from your Online Marketing department. This post will explain the most valuable metrics you can measure, how to obtain them, and how to interpret them.
What is Facebook Insights?
Facebook Insights is the Facebook analytics tool that offers you relevant data from your fan page during a certain period. Some are user characteristics, behavior, demographics, or most successful posts.
It is native, free, and so complete that you do not need any other external tool to know what is happening on your page. As we will see in this post, you can learn key aspects that help you improve your business strategy on this social network. For example:
- Identify the best posting time.
- Check if your target audience corresponds to your followers and fans.
- Know if the content you publish is liked by your community and which are the best and worst.
- Observe the pages of your competitors.
- The reach of your posts.
- What is the profile of the people who pass near your store if you are a local business?
How to see Facebook statistics?
There are two fairly simple conditions for you to be able to see the statistics of a Facebook page:
- That you have at least 100 fans in it.
- That you have a role (everyone gives you access).
From there, accessing the data is as easy as going to your page and clicking on the “stats” tab in the top menu.
When you do, you will find a different menu in the left column depending on the template you have installed. Most are common to all, but local businesses have other options.
How to use and interpret Facebook Insights Statistics?
Now, let’s see what those sections you can analyze on your fan page. But we are not going to stop at just pointing them out. We will also explain how to interpret them to achieve maximum profitability of the page and, therefore, the use of it for your business.
General information
This is the first tab you find on the Statistics of your fan page. It is a kind of summary of some data:
Page Summary
You can filter by: today, yesterday, last 7 days, and 28 days. Unless you carry out a very detailed analysis at an interpretive level, we recommend seeing each section separately.
The tool redirects you to the corresponding specific section by clicking on any of these boxes.
The most important thing here is the option to “Download Data”. From there, you can request an Excel or CSV of all the variables that Facebook Insights measures.
Most recent promotions
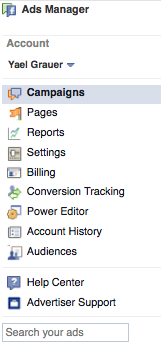
As in the previous case, here you will find the summary of the ads you have made, but we recommend that you look at this data in the Business Manager or the Ads Manager.
We are playing an economic budget, and it is not advisable to settle for superficial interpretations. It is preferable to see it in depth in the section that Facebook already has dedicated to them.
Watch Pages
This is the other important section of this first general information tab. Here you can observe your competition. The good thing is that you can point to the pages you want to view, but Facebook also makes suggestions!
What is this for?
One of the first steps of a Social Media Plan is to analyze the competition to learn from it and improve our strategy. Well, here you have the utility that Facebook offers you. Take advantage of it!
Promotions
In this second tab of the menu on the left column, we see a summary (less concise than the previous one) of the announcements we have made. If you haven’t done any, it will appear without content and a Call To Action for you to start your promotions.
Followers
In this section, you know the number of followers on your Facebook page. Of course, this is one of the most important pieces of information because what would you do without a community? Do not forget this! It is a vain metric we all like, but engagement is more so.
About the report we seek to create with this data, it is convenient that you select the date you are analyzing (here and in the rest of the variables you will find in the menu tabs). This way, you can track and see the evolution of your project.
You can do it with the calendar or the acronyms next to it (last week, last month, and last quarter).
Total Followers to date
If you don’t select a date, this is where you can see the total number of followers your Page has. Although the interesting thing, again, is that you filter a period each time you make a report to be able to compare with the oldest ones and see the evolution of your business.
Net followers
Have you gained or lost followers? Find out here and see what you posted that day they unfollowed you. In any case, to know the best and worst publications, you should download Excel. It can give you a clue about what kind of content your community likes the least.
There are 3 types of followers :
- Those who have stopped following you
- Organic followers, that is, those you get without advertising (these are the best because they are the answer to the quality of your content).
- Paid followers, which you get through advertising.
Facebook’s algorithm, called EdgeRank, gives you more visibility the higher your engagement, not the number of fans. If you invite discretion to raise that value, you will have many users who do not care about your page’s theme or content. And if they don’t do anything, if they don’t interact, Facebook thinks that your content is bad and will reduce your reach, which means less success for your business.
So, from now on, are you going to think about who to invite to your fan page?
Source of tracking for your page
Where did you get your followers? Do you have no idea about ads, on the page, in suggestions, or on Facebook?
Depending on the origin, different options appear. However, this is not one of the most important metrics for reporting unless you report at a very high level of detail.
Although you do not include it in them, it is interesting that you visually review this graph, at least for you, and reflect on it for a couple of minutes.
I like it
We are facing a section very similar to the previous one. The difference is that here we talk about the number of fans of your page. we will not be repetitive, so we will not talk to you about the same thing again. The reflections of the previous chapter are the same, which you can apply here.
Scope
First, correct the date because the selection may have been deleted. Second, do you know the difference between reach and impressions?
- Reach is the number of unique users who have seen your post.
- The same person may have seen it more than 1, or perhaps it has appeared in your feed, and you have not even noticed it. Impressions are the number of times your post has been shown.
Scope of publication
The number of people who have seen your posts organically and with paid promotions. Remember that it is better to go to Business Manager or Ads Manager to analyze your ads.
Recommendations
They are the number of recommendations that make our business on the Facebook page. Remind everyone in your posts from time to time.
Reactions, comments, shares, and more
We will join the following two sections here:
Facebook values reactions and shares (including comments) more than likes. That is why it is interesting to see how these values have gone in it. They are the variables of the engagement formula, which we will see in the section on downloading Excel.
Hide, report spam, and “I don’t like it anymore”
Many times we like a page without giving it much thought. You can’t like everyone, so don’t worry if you have any regretful followers. And if you make ads to attract fans, it is normal that you lose some later.
As long as they are punctual, there is no need to worry, and it is not worth reflecting on it in the reports. But if this is recurring, think about what you are doing wrong in your strategy.
Overall scope
What is the difference between the “scope” we saw a few lines above and the “total scope”?
In Facebook Insights, reach refers to posts. Total reach depends on whatever aspect of your page has been displayed. In other words, this second offers a higher number of unique users who have seen “something”, be it a publication, schedule, or another detail.
When creating your report, and from our point of view, the scope of the publications is more valuable. This is where we focus our content strategy. It is where we add value to users, where we answer their questions, and where we differentiate ourselves from competitors.
The rest of our visibility is welcome, but it is almost certainly a consequence of the first. The more useful we are to our community, our total reach will.
Visit the (Facebook) page
First, remember to adjust the analysis period you are doing. Let’s go to the next.
Facebook Insights allows you to know the number of times they have visited the wall of your fan page, some of its characteristics, and how they have arrived (Facebook itself, Google, your website…)
Page previews
In our opinion, this is one of the expendable metrics of the Statistics offered by Facebook Insights.
Note that:
- It does not show the calendar months but the last 28 days.
- The time is Pacific time.
Actions on the page
Maybe you can get some interesting information from this section.
Those people who have seen your fan page, what have they done? Where have they interacted? Where have they clicked?
Facebook shows you actions on:
- How to get there, if you are a local business and have detailed your address.
- your website
- Your phone number
- Call to action buttons.
- How many people have clicked, their age, gender, country, city, and device used? The previous variables break all this down.
Publications
We come to another of the important sections of the Facebook Insights statistics.
Here we find 3 different tabs that share a common information block. We see them:
When your fans are online
Facebook tells you very clearly that the data is from the last week, but it is easy to extrapolate, so take good note of these values because they are the ones that tell you when is the best time to publish.
Pay attention to what we are going to explain to you. Note that the hours are according to the Pacific. We leave you the time zone conversions of Spain. Please check with your country which one it is.
23h LAN > 08h in ESP
03h LAN > 12h in ESP
07h LAN > 16h in ESP
16h LAN > 01h in ESP
At 11 p.m., that is, at 8 a.m. In the USA, this page’s peak of connected users and fans rises. The peaks are at 1:00 p.m. and 10:00 p.m. ESP, then drops sharply.
When do we publish? If we did it this time, our content would have a shorter life. Therefore, it seems better to do it at 08h.
However, you may notice that this is a peak hour for Facebook posts, so if you’re not a big brand with tens of thousands of fans, no one will likely see you. So, let’s reconsider if this is the best time. Probably not.
Then? It’s about finding that time when you have a good number of connected followers, and there is less competition from other pages.
In this case, we would lean towards the 6h of LAN, that is, the 15h of ESP
But as each project is a world, we recommend trying for a couple of months. One month always publish at one time and another at another. Measure the engagement of each one and compare. Decide the schedule based on when you have obtained the best results.
we will give you another little tip on the image below. If you put the mouse over one of the days of the week, you will see the curve of connections that corresponds to it. This is interesting because you can have a lot of differences between the weekdays and the weekend, which determines your posting schedule.
Do not stop reviewing it.
Post Types
What content do you think has worked best on your fan page?
In your case, look at what it is and enhance it.
Featured posts from your Watch Pages
We already know how it went for you. What about your competition?
There you can see the most successful posts of your competitors. Read them, investigate why they have achieved these results, assess whether they apply to your business, and implement them with improvements.
All posts made
This is the common data that the previous 3 sections have.
You can see the publications that have had the most interactions, but be careful! It does not mean they are the most successful because you must consider the scope.
Here you could apply the engagement formula, but it is very laborious because you would have to do it manually.
Working with Excel data that you can download is more comfortable and faster.
Events
Remember that you can publish your milestones as an event! That will give you much more visibility. And, the place to measure what has happened with it is here.
You have available to know what happened in them and filter the last 7 or 28 days, regarding:
- The spread achieved
- The interactions received
- tickets sold
- The demographics of the audience reached
Don’t forget this option to give visibility to your congresses, courses, streamings, etc.
Videos
With Facebook Insights, you can analyze how your published videos have fared (in pure competition with YouTube?).
Again, you can select the date of the period you are analyzing for your report.
Here are the 2 most important KPIs for the metric: minutes played and the number of plays longer than 3 seconds.
It also shows you a small list of the most outstanding ones, and if you click on any of them, that will show you the specific details.
People
Another important section of Facebook Statistics.
Here we find the characteristics of our fans. And the question is clear: are they aligned with your target, with your target audience?
You have the segmentation of this graph to know the characteristics of age and gender of:
- your fans
- your followers
- People reached out with your posts.
- People who have interacted with your posts.
That said, very interesting for you to verify if you are reaching the public you need for your business. If not, change the content you post. Regarding the location of these groups of people, Facebook Insights also shows us interesting values, especially if you are a local business, as is the case here.
It is a business located in Barakaldo, and we are interested in finding followers from that town and its surroundings. Check yours! It seems to be going well.
Local broadcast
This tab will not appear if you have not specified that you are a local business in your Facebook template. The very interesting data that you will find here are:
- The day and hours of maximum concurrence around your business (be careful if you are in a restaurant area and you are not from the sector because it is likely that Facebook will suggest you open on a Saturday night).
- The predominant age group in that area.
- The day that your ads have had the most impact.
- The demographics of the people you are close to.
Messages
If you want to encourage the interaction of your users or if you launch Facebook Ads focused on conversing with your fans, this section is highly relevant for you.
In it, you have the statistics of Facebook Messenger’s private messages you have received.
Select the period to analyze and assess whether the messages received correspond to your goals. If not, change your strategy and find another way to approach them.
Orders
It does not appear on all Facebook pages, but if it does, in your case, the information you obtain is related to the follow-up of the sales you marked as paid in Messenger. That is the conversion that you say you have achieved in this way.
Download the Facebook Insights Excel
Now that we have reviewed each of the menu tabs in the left column, we have to go back to the beginning, to “General Information,” to download all the details seen in the post.
When you do, you will get 3 options:
- page data
- publication date
- video data
We are going to see the second, which is the one that tells us which is the best and worst publication of the selected analysis period. Clicking on “export data” downloads an Excel file. Please find it in the folder.
You will see that infinity of tabs appear, but do not be scared because only with the 3 of them will we be able to know:
- The average engagement of the period
- best post
- the worst post
It is time to remember the engagement formula that we showed you a few lines above. Let’s find the numerator and denominator.
>> In the first tab of Excel, “Key Metrics”, we look for the total reach (includes organic and paid).
>> In the second tab, “Lifetime Talking About…” we find the likes received and the shares.
>> In the fourth, “Lifetime Post consumers by…” we have the clicks we need to complete the formula.
>> Now, we only have to organize Excel, apply the formula, and order from highest to lowest according to engagement.
Facebook Analytics Tools
We have already seen everything you can analyze with Facebook Insights. As a Social Media trainers and professionals, We should tell you that it is important that you learn how to make reports on your business. But, if you don’t want to spend a lot of time on it, you can have support with tools that get these values for you.
But, we insist, it seems important that you know where they come from because it may be the case that you need to delve into some of the metrics, and you cannot do it in an automated way.
Next, we will name some of those digital analytics tools we like the most and recommend them in case you want to use them.
Metrical
Metrical is the most simple, intuitive, complete, and economical for me. In addition to giving you that social network analytics, it generates reports you can customize with your logo.
But not only that, you can use it to program your publications, observe your competition and automate auto lists.
They have a Freemium version and a version for professionals for only €10/month, in which you can upload up to 10 different profiles.
Karma fan page
Fanpage Karma is an excellent tool to analyze your social networks and those of your competition. It is one of the best we have tried for the latter.
Its drawback is in the price, not because it is paid, but because of how high it is. The cheapest plan costs €49.90 and only gives you access to Facebook. It is probably best suited for agencies that have a wider use for it.
LikeAlyzer
LikeAlyzer is a very simple free tool for dummies. You have to paste the URL of the fan page you want to analyze, and you will have its statistics in a few seconds. You can also use it to know slightly how your competition is doing. Recommended if you do not want to complicate the process too much.
Conclusions
You have seen that the world of analytics on Facebook is very wide. For this reason, as we told you at the beginning, we recommend that you do two stages:
- Know in-depth everything you can know about your fan page.
- When you know it, choose the KPIs and measure only the relevant metrics.
Unless your strategy is strongly based on this social network, you should always do in-depth analytics; a smaller version is usually sufficient.
Do you have plans to use these new insights to learn about your audience on Facebook? Share in the comments.
Want more practical marketing tips and advice? Get the VR Buzz delivered daily.
© 2014 – 2018, Contributing Author. All rights reserved.
